Why Dyno Numbers Lie: What 350Z Owners Should Track Instead
Your 350Z made 280whp at one shop, 310whp at another, and now you’re questioning everything. The truth is both numbers are probably accurate for their specific conditions, but neither tells you what you actually need to know about your VQ35DE build. Peak power is the least useful metric for measuring real-world performance.
Quick Answer
- Dyno variations of 20-30whp are normal due to correction factors, temperature, and equipment differences
- Torque curve shape matters more than peak numbers for street performance and quarter-mile times
- Timing consistency under load reveals tune quality better than any peak power figure
- AFR stability across the rev range shows whether your fuel system can support the power
- Track these three metrics instead: area under the torque curve, knock events per pull, and AFR deviation from target
Dyno correction factors: Mathematical adjustments applied to raw wheel horsepower readings to account for atmospheric conditions, designed to standardize results but often creating 15-25whp variations between facilities.
Why Your 350Z’s Dyno Numbers Change Between Shops
Every dyno operator runs different correction factors. SAE J1349 versus STD correction can swing your numbers 15whp on the same car, same day. Ambient temperature, humidity, and barometric pressure all feed into these calculations differently. A Dynojet 248C at sea level in 15°C weather will read higher than the same setup at 1000 feet elevation in 30°C heat, even with corrections applied.
The dyno’s load cell calibration matters more than you think. Most shops calibrate annually if you’re lucky. A 2% drift in the load cell translates directly to a 6whp error on a 300whp car. Roller diameter, bearing condition, and tire pressure all affect the actual numbers. This is why chasing peak figures between different facilities is pointless.
Your VQ35DE doesn’t care what the dyno computer says. It cares about making consistent power under real driving conditions. Focus on the data that actually translates to street performance and engine reliability.
What the Data Actually Shows About Your VQ35DE Build
The torque curve tells the real story. A 350Z that makes 280whp with a flat torque curve from 3000-6500 RPM will destroy one that peaks at 310whp but falls off hard after 5500 RPM. Area under the curve directly correlates to acceleration and quarter-mile performance. Your transmission has to work less when torque stays consistent across the usable rev range.
Timing advance consistency reveals tune quality instantly. A properly tuned VQ35DE holds 28-32 degrees of timing advance under full load from 4000-6000 RPM on 93 octane. If you see 4+ degrees of variation in timing advance during a power pull, your tune isn’t optimized. The ECU is pulling timing to prevent knock, leaving power on the table.
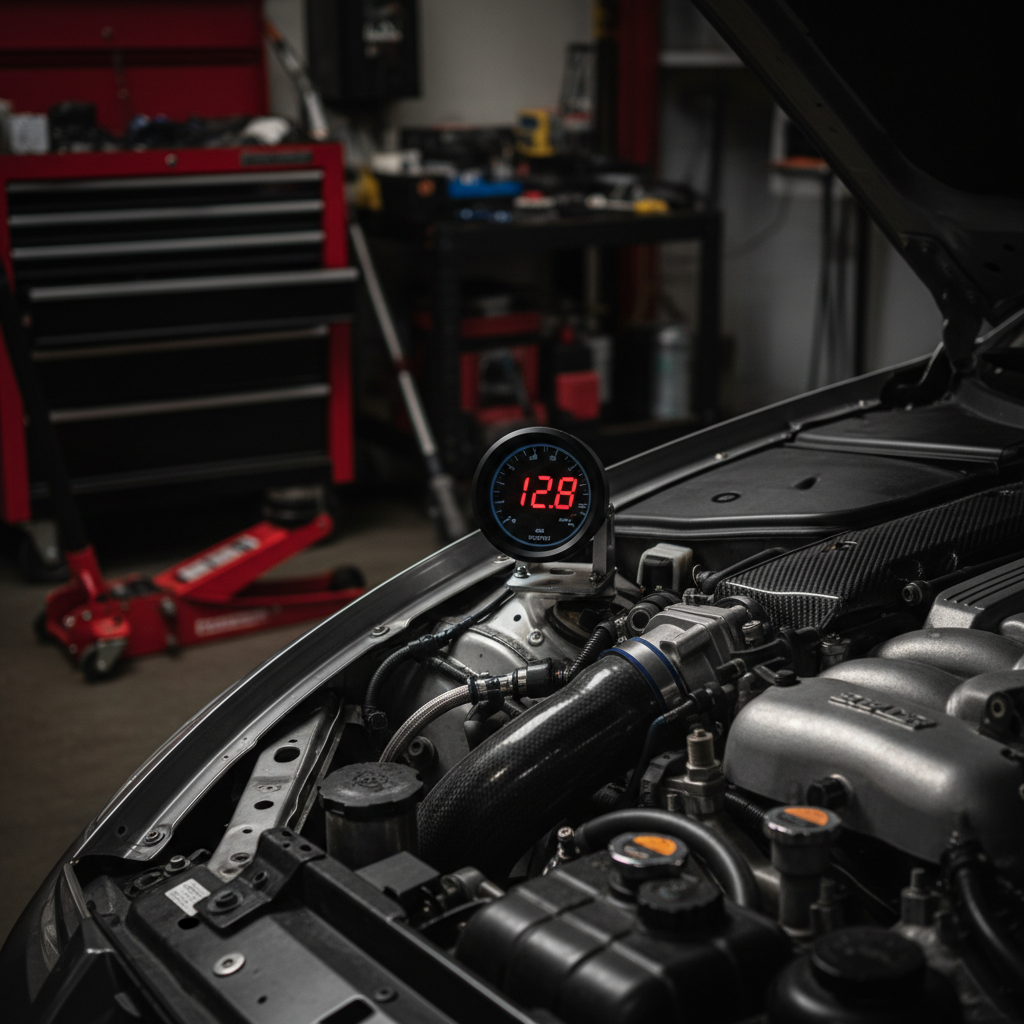
AFR stability matters more than peak numbers for longevity. Target AFR on a naturally aspirated VQ35DE should hold 12.8-13.2 under full load. Deviations larger than 0.3 AFR indicate fuel system limitations or poor injector flow matching. This shows up long before you hit fuel system limits on peak power.
The Three Metrics That Actually Matter for Your 350Z Build
Track area under the torque curve instead of peak power. Calculate the average torque between 3000-6500 RPM and multiply by the RPM range. This number directly correlates to real-world acceleration. A car with 220 average lb-ft over 3500 RPM will feel faster than one with 240 peak torque that drops to 180 lb-ft by 6000 RPM.
Count knock events per dyno pull. Zero knock events indicate proper octane mapping and timing optimization. One or two light knock events might be acceptable during aggressive tuning, but consistent knock above 4 counts per pull means you’re leaving power on the table or risking engine damage. Modern knock sensors on the VQ35DE are sensitive enough to catch detonation before audible knock occurs.
Monitor AFR deviation from target across the entire pull. Calculate the standard deviation of your AFR readings during the power band. Values below 0.2 indicate excellent fuel system control. Anything above 0.4 suggests injector flow issues, fuel pump capacity problems, or poor ECU tuning. This metric predicts reliability better than any peak power figure.
What Goes Wrong When 350Z Owners Chase Peak Numbers
Aggressive timing maps for peak power often sacrifice midrange torque. Tuners will advance timing at the top of the rev range to hit a power target, but this typically costs 10-15 lb-ft in the 4000-5500 RPM range where you actually drive. The result is a car that dyno sheets well but feels slower on the street.
Lean AFR tuning for maximum peak power reduces engine longevity significantly. Running 13.8-14.2 AFR under full load might add 8-12whp at the peak, but it increases exhaust gas temperatures 50-80°C and raises the risk of detonation. The VQ35DE’s aluminum pistons don’t tolerate sustained lean conditions well.
Ignoring torque curve shape leads to poor drivability modifications. Owners see peak power gains from aggressive cam timing or intake manifold swaps without considering how these changes affect the power band. A modification that adds 15whp at 6800 RPM but costs 20 lb-ft at 4000 RPM makes the car slower in real driving conditions.
Dyno tuning without considering heat soak gives unrealistic expectations. Most dyno sessions run with fans blowing directly on the intercooler and engine bay. Your VQ35DE will make different power after 10 minutes of highway driving when underhood temperatures climb 40°C above dyno conditions. This is why street tuning validation matters more than perfect dyno numbers.
How much variation in dyno numbers is normal for a 350Z?
Expect 15-25whp variation between different dyno facilities, even on the same day with the same car. Temperature corrections, altitude adjustments, and equipment calibration all contribute to this spread. A properly tuned VQ35DE should show consistent AFR and timing advance regardless of which dyno reads the power numbers. Focus on the quality of these parameters rather than peak power figures when comparing results between shops.
What AFR should my naturally aspirated VQ35DE target under full load?
Target 12.8-13.2 AFR under full load for optimal power and safety on pump gas. This provides adequate cooling for the combustion chambers while maintaining good power output. Leaner mixtures above 13.5 AFR risk detonation and excessive exhaust gas temperatures on the VQ35DE’s aluminum internals. Richer mixtures below 12.5 AFR waste fuel and reduce power without providing additional safety margin on a naturally aspirated engine.
Why does my 350Z feel slower even though it made more peak power?
Peak power occurs at high RPM where you spend minimal driving time. A tune that sacrifices midrange torque for peak power will feel slower in real driving conditions. Check your torque curve between 3000-5500 RPM where the VQ35DE does most of its work. A car that loses 15 lb-ft at 4000 RPM but gains 10whp at 6800 RPM will feel less responsive during acceleration despite the higher peak numbers.
How do I know if my 350Z tune is actually optimized?
Look for consistent timing advance of 28-32 degrees under full load with zero knock events, stable AFR within 0.2 of target throughout the power band, and a smooth torque curve without sudden drops. These metrics indicate proper optimization regardless of peak power numbers. A well-tuned VQ35DE maintains these parameters consistently across multiple dyno pulls and ambient conditions.
Stop chasing dyno queen numbers and start tracking the data that actually matters. Your quarter-mile times and street performance will improve more from optimizing torque curve shape and tune consistency than from adding 20whp at the peak. TorqueMetrics gives you the tools to analyze these critical parameters properly, so you can see what your VQ35DE is really doing beyond the peak power number.